How long will my pension pot last? A £300,000 example
Figures correct for the 2026/27 tax year. Last checked against GOV.UK and MoneyHelper on .
Information, not financial advice. Life Cashflow is not authorised by the FCA.
Short answer
How long will my pension pot last?
How long a pension pot lasts depends on how much is taken out each year, other income such as the State Pension, investment growth, charges, inflation and tax. In Robin's invented example, with a £300,000 pot, £50,000 of savings and the full State Pension, spending £28,000 a year lasts to 90, while spending £34,000 runs out at 83.
 Open this example in the planner.
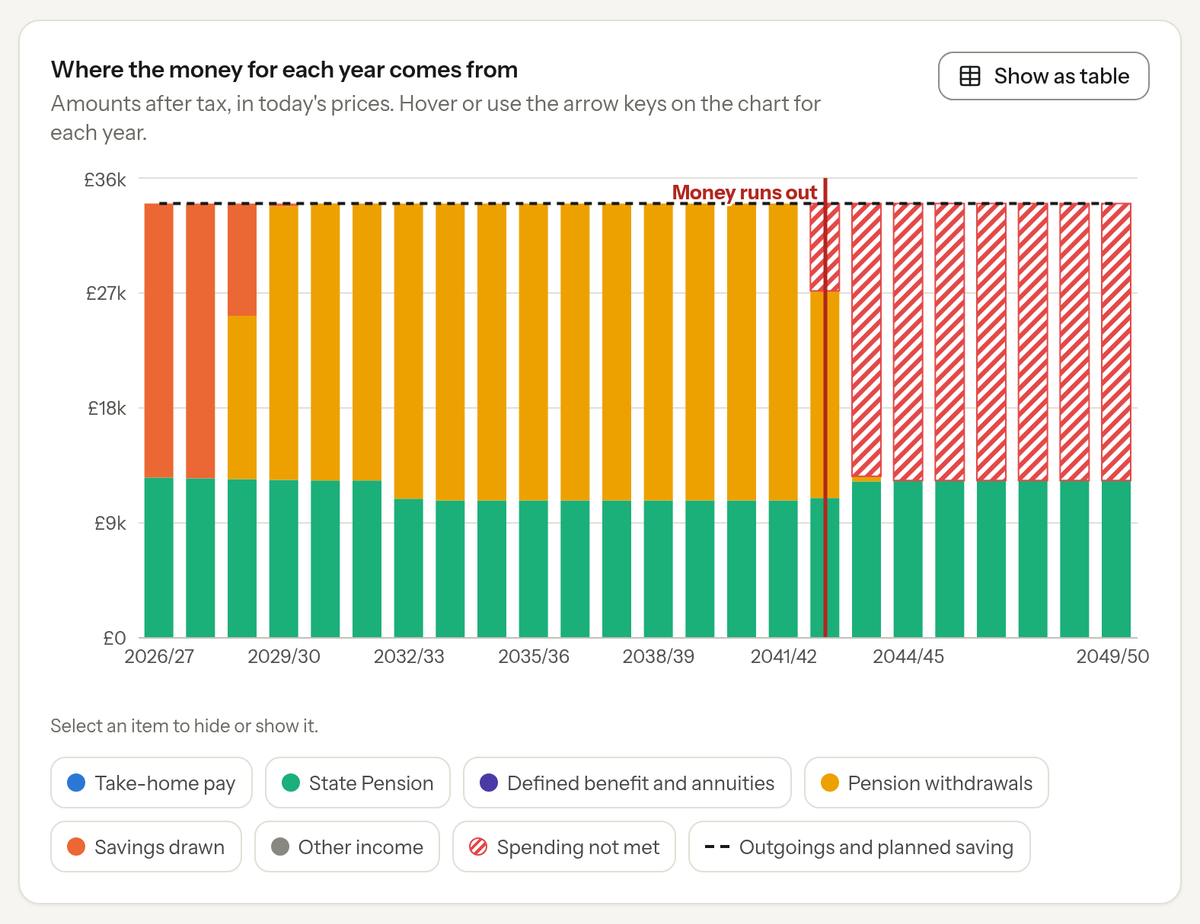
In this example, Robin is 67, gets the full State Pension and has a £300,000 pension pot and £50,000 of savings. Spending £34,000 a year, the savings are used first and the pension from 69, and the money runs out in 2042/43, at 83. From then on the State Pension alone does not meet the spending, and £6,836 is not met that year, in today's prices. Robin is an invented example, and the chart is an illustration of the planner's arithmetic, not a forecast.
Assumes 2.5% inflation a year and steady growth of 5% a year on pensions and ISAs, and 3% on cash and the home, before charges. Tax rules are those for 2026/27 and later years as now legislated, and can change. Real returns vary, and the value of investments can go down as well as up.
Open this example in the plannerDownload Robin's example plan (a JSON file: in the planner, choose File, then Open a saved file)
Key facts
- A pension pot lasts until withdrawals, charges and any falls in its value use it up, so there is no fixed number of years.
- The full new State Pension is £241.30 a week in 2026/27. It is paid from State Pension age, alongside anything a pension pot provides.
- Up to 25% of a pension can usually be taken tax-free, up to £268,275 in total for most people, and the rest is taxed as income.
- Because withdrawals can be taxed, meeting £1 of spending can take more than £1 from a pension pot.
- In Robin's invented example the same £300,000 pot meets spending of £28,000 a year to age 90, but at £34,000 a year spending is not met in 8 years, from 2042/43.
- The planner grows investments at one steady rate, so it cannot show how poor returns early in retirement can shorten how long money lasts.
A pension pot lasts until the money taken out of it, its charges and any falls in its value use it up. How long that takes depends on how much is taken out each year, what other income there is, how the investments perform, inflation and tax, so there is no single number of years. A cashflow model works it out year by year for one set of assumptions.
What decides how long a pension pot lasts?
Five things do most of the work:
- How much is taken out. Spending that other income does not cover is drawn from savings and the pot, every year, so a higher level of spending is drawn again and again.
- Other income. The full new State Pension is £241.30 a week in 2026/27. It starts at State Pension age, which when can I retire? explains, and reduces what the pot has to provide. A defined benefit pension, an annuity or part-time work does the same.
- Growth and charges. A pension pot is invested, so its value can go down as well as up, and charges are taken from it every year. How pension and investment fees add up shows the effect of the charge.
- Inflation. Spending usually rises with prices, so the amount needed each year grows in pounds.
- Tax. Up to 25% of a pension can usually be taken tax-free, up to £268,275 in total for most people, and the rest is taxed as income. Meeting £1 of spending can take more than £1 from the pot. How much tax will I pay on my pension? explains the tax.
How long a person lives is the other unknown. A plan has to run to an age chosen in advance, 90 in the planner unless you change it, and real lifespans vary.
What does the example show?
Robin is an invented example: 67, retired, getting the full State Pension, with a £300,000 personal pension, £50,000 of savings in cash and an ISA, and a home owned outright. The two scenarios differ only in spending, £28,000 or £34,000 a year in today's money.
| In Robin's example | Spending £28,000 a year | Spending £34,000 a year |
|---|---|---|
| Pension first drawn | 2029/30, at 70 | 2028/29, at 69 |
| Money runs out | Not before the plan ends, at 90 | 2042/43, at 83 |
| Years in which spending is not met | None | 8 |
| Left in savings and pensions at the end, at 90 | £16,696 | Nothing |
In both scenarios Robin's savings are used first and the pension after them, because that is the planner's starting withdrawal order, and the order can be changed. At £34,000 a year the money runs out in 2042/43, at 83. From then on only the State Pension is left, and £6,836 of Robin's spending is not met that year, in today's prices, with more not met in each year after.
The planner does not rank the two. Which level of spending suits someone, and how much they would want left at the end, depends on their circumstances and aims.
What this looks like in the planner
The picture at the top of this page is Robin's Cash flow view at £34,000 a year. Each bar is a year's money after tax: the State Pension at the bottom, then savings and pension withdrawals, until a red line marks the year the money runs out and hatched bars show the spending that is not met.
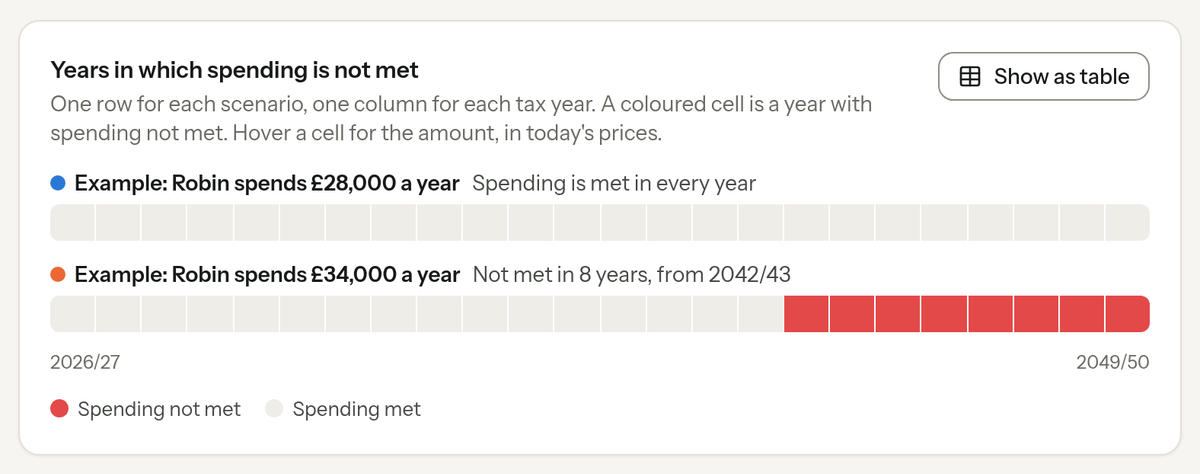
The Compare view puts the two levels of spending side by side, one strip for each, with a coloured cell for each year in which spending is not met.
 Open this example in the planner.
In this example, the same person is shown spending £28,000 or £34,000 a year, with everything else the same. At £28,000 spending is met in every year to 90; at £34,000 it is not met in 8 years, from 2042/43, at 83. Robin is an invented example, and the chart is an illustration of the planner's arithmetic, not a forecast.
Assumes 2.5% inflation a year and steady growth of 5% a year on pensions and ISAs, and 3% on cash and the home, before charges. Tax rules are those for 2026/27 and later years as now legislated, and can change. Real returns vary, and the value of investments can go down as well as up.
Open this example in the plannerDownload Robin's example plan (a JSON file: in the planner, choose File, then Open a saved file)
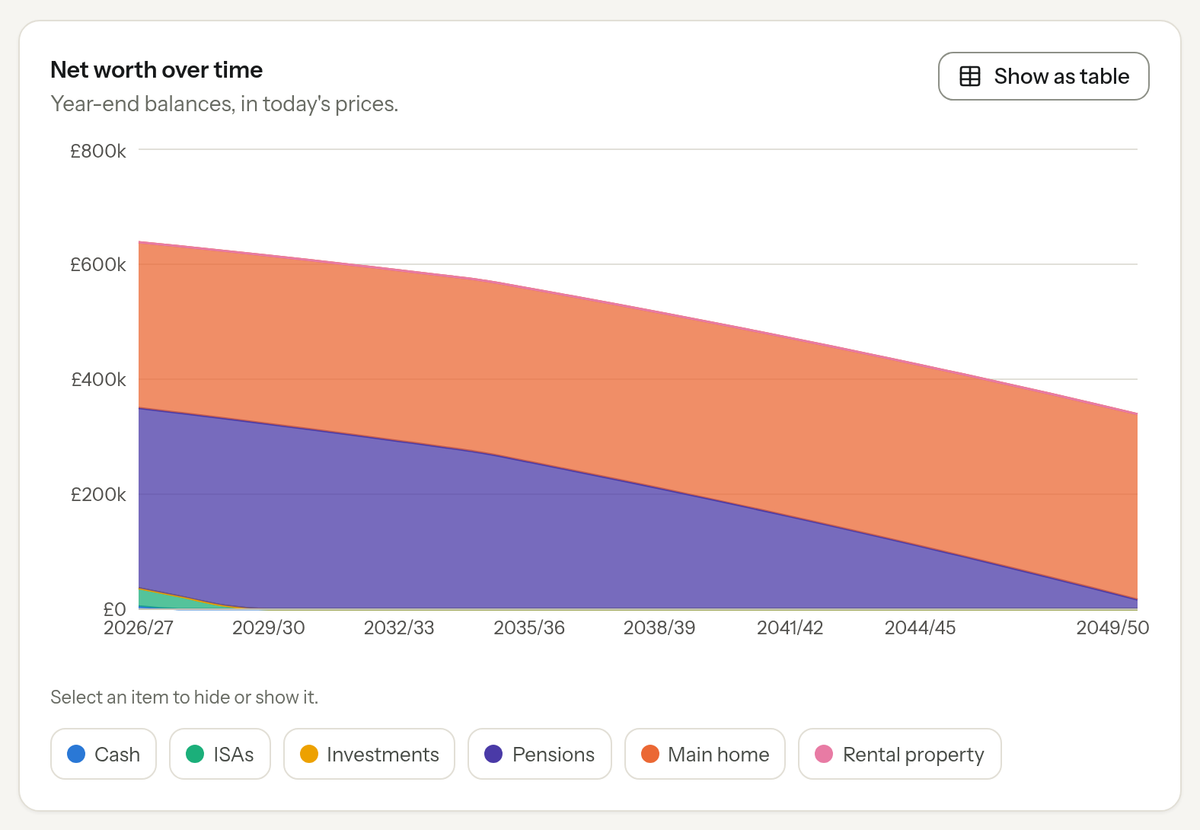
The Wealth view shows Robin's savings, pension and home at the end of each year. At £28,000 a year the cash and the ISA go first, then the pension falls steadily, to £16,696 at the end of 2049/50, in today's prices.
 Open this example in the planner.
In this example, Robin spends £28,000 a year. The savings are used first and the pension from 70, and spending is met in every year to 90, with £16,696 left in savings and pensions at the end of 2049/50, in today's prices. Robin is an invented example, and the chart is an illustration of the planner's arithmetic, not a forecast.
Assumes 2.5% inflation a year and steady growth of 5% a year on pensions and ISAs, and 3% on cash and the home, before charges. Tax rules are those for 2026/27 and later years as now legislated, and can change. Real returns vary, and the value of investments can go down as well as up.
Open this example in the plannerDownload Robin's example plan (a JSON file: in the planner, choose File, then Open a saved file)
Open Robin's example in the planner, or open it on the Compare view. The example is invented, and its growth rates are assumptions: real returns vary, and the value of investments can go down as well as up.
What does the planner leave out here?
- Steady growth. Each account grows at one steady rate. Real returns go up and down, and a run of poor years early in retirement can make money run out sooner than a steady rate shows.
- A fixed lifespan. Each person is planned to an age chosen in advance and treated as living to exactly that age.
- Benefits and care. Pension Credit and other benefits are not modelled, and care costs are included only if they are entered as life events.
- Future State Pension increases. The State Pension rises with the inflation assumption. The planner does not forecast the triple lock.
What the planner simplifies or leaves out lists the rest.
Where can I get free guidance about taking a pension?
Pension Wise, from MoneyHelper, offers free, impartial guidance appointments about the options for a defined contribution pension to people aged 50 or over, and MoneyHelper gives free guidance on money and pensions to anyone. Personal advice on how to take a pension comes from a regulated financial adviser, usually for a fee, and the FCA Register shows whether a firm is authorised. Financial guidance and advice explains the difference.
Change the inputs to your own in the planner to see the same calculation for your own figures, year by year. The planner simplifies some things, and what the planner simplifies or leaves out lists them.
Change the inputs to your own in the planner to see how long your own savings and pensions last on the assumptions you choose.
Open the plannerFrequently asked questions
How long will a £300,000 pension pot last?
There is no single answer, because it depends on how much is taken out each year, other income, growth, charges, inflation and tax. In Robin's invented example, a £300,000 pot with £50,000 of savings and the full State Pension meets spending of £28,000 a year to age 90, and runs out at 83 at £34,000 a year, on the assumptions given with the charts.
Does a pension last for life?
It depends on the kind of pension. A lifetime annuity bought with a pension pot pays an income for life, though some annuities pay for a fixed time instead, and the State Pension and a defined benefit pension pay an income each year from the age they start. Money kept invested in drawdown lasts only as long as the pot does, and its value can go down as well as up.
What happens when a pension pot runs out?
Withdrawals stop, and income that does not come from the pot carries on, such as the State Pension or a defined benefit pension. In the planner the first year this happens is marked with a red "Money runs out" line, and any spending the remaining income cannot meet is shown as not met. Pension Credit can add to the income of some people over State Pension age on a low income; the planner does not model benefits.
Do I need 30 or 35 years of National Insurance for a full State Pension?
For the full new State Pension you usually need 35 qualifying years, and at least 10 to get any State Pension. If your National Insurance record started before April 2016 and you were contracted out, you usually need more than 35. A State Pension forecast on GOV.UK shows your own record.
Can the planner show how long my own pension pot would last?
It shows what your own figures lead to, year by year, on the assumptions you choose, and marks the first year in which spending is not met. That is arithmetic, not a forecast, and the planner does not say how much anyone ought to spend. Free, impartial guidance is available from MoneyHelper, and Pension Wise offers free appointments to people aged 50 or over with a defined contribution pension.
Try this example in the planner
Robin's example opens on the Cash flow view at £34,000 a year, next to the same plan at £28,000. Changing the spending, the growth rate or the age the plan runs to shows how the year the money runs out moves.
The example is invented. It opens as a scenario of its own that you can change, and anything of yours that is open stays as it is.
Download Robin's example plan as a JSON file, and open it in the planner with File, then Open a saved file.
Sources
Checked against these sources on , for the 2026/27 tax year.
- Personal pensions: how you can take your pension (GOV.UK) (opens in a new tab) (gov.uk)
- Tax when you get a pension (GOV.UK) (opens in a new tab) (gov.uk)
- The new State Pension: what you'll get (GOV.UK) (opens in a new tab) (gov.uk)
- Check your State Pension forecast (GOV.UK) (opens in a new tab) (gov.uk)
- Types of private pensions (GOV.UK) (opens in a new tab) (gov.uk)
- Pension Credit (GOV.UK) (opens in a new tab) (gov.uk)
- Pension Wise (MoneyHelper) (opens in a new tab) (moneyhelper.org.uk)